Tag Archives: cfa

Should I Invest at All-Time Highs?

By Don Keeney, CFA, CFP®

“Should I invest now (or stay invested) if the stock market is at all-time highs?” Given there are so many all-time highs in the stock market, we are asked to answer this question with shocking frequency. We know that over time the market goes up, but there tends to be more emphasis and concern about the timing of the next drop or bear market. It is enticing to think we can manage our portfolios to avoid such situations. In reality, if an investment’s time horizon was long enough, the stock market has ALWAYS provided positive returns. So, how long is “long enough”?

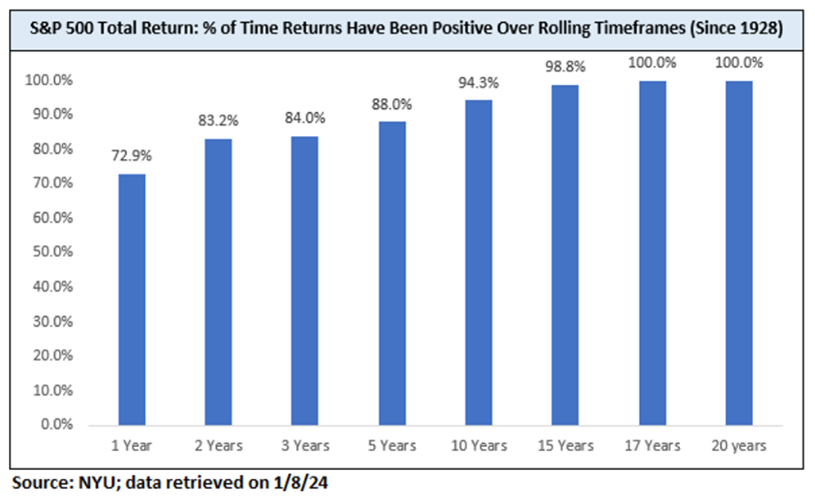
Since 1928, S&P 500 returns have been positive over a one-year period 73% of the time1. Not a bad percentage! If you have a ten year investment time horizon, which most of our clients do, the stock market has produced a positive return in 94% of those ten-year periods. When we extend the time horizon to twenty years, we see that returns have been positive 100% of the time. Although past performance is not indicative of future results, historical data shows that staying invested through market turbulence has always been the better decision.

Conversely, what happens when the market is at all-time highs? Let’s first look at a chart depicting S&P 500 returns since the 1950s:

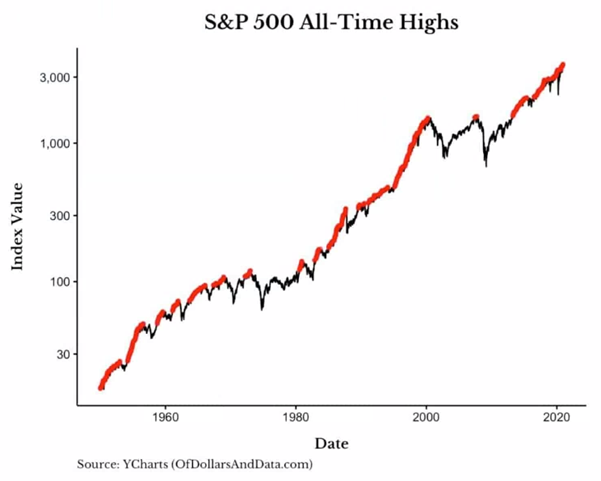
Each red instance on the accompanying chart represents days when the stock market reached an all-time high. As expected, this chart does have periods where the market did not reach its peak (i.e., returns represented by a black line), but there are more red sections than there are not. One of the most interesting components of the chart is that the red portions tend to bunch together. In other words, all-time highs have historically signaled more all-time highs. While different analysts and economists often debate the market and its parameters, the data supports this general concept in almost every case!

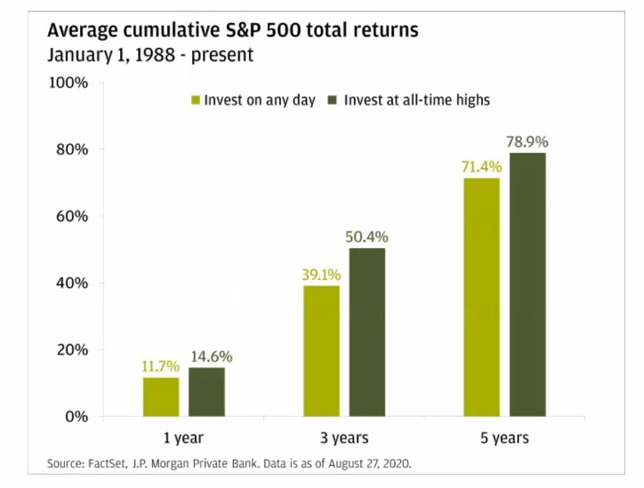
The following table pulls from a 1988-2020 dataset of market returns and supports the claim that investing during all-time highs has not been detrimental to investors. Over this time period, the average one year return in the stock market following an all-time high was 14.6%, beating the average return from investing on any given day throughout the data sample. Cumulatively, over the next five years following an all-time high in the market, an investor’s portfolio would have done materially better by investing at an all-time high as opposed to picking any other starting day at random (78.9% vs 71.4%).

The data – despite its source or time frame – generally comes to the same conclusion: one is better investing at all-time highs than they are by picking a day at random to invest. There is a consensus throughout financial research that this benefit has the greatest impact  for time periods in the 1-5 year range. Said differently, as your investment horizon extends, timing takes a back seat to consistency when considering the long-term benefit.  In the long run, the market goes up and investors are compensated time and time again for the risk they are taking.

By knowing your risk tolerance and your investment horizon (the time you have until you need to access your money), you can invest intelligently and improve your specific long-term outcomes. We encourage portfolio diversification and client-specific market risk exposure. This is why we prioritize knowing clients’ parameters and risk tolerances here at Cahaba Wealth.

Arguably the greatest caveat to our discussion is that no one can successfully and consistently time the market over the long run. This has been proven time and time again! Pretending to know which all-time high is the last one for the foreseeable future is nearly impossible. Stay away from this trap. Be diversified, take the appropriate amount of market risk and stay invested!

1 https://farrmiller.com/blogs/insights/the-power-of-staying-invested

Don Keeney, CFA, CFP® is a financial advisor in the Nashville office of Cahaba Wealth Management, www.cahabawealth.com.

Cahaba Wealth Management is registered as an investment adviser with the SEC and only transacts business in states where it is properly registered, or is excluded or exempted from registration requirements. Registration as an investment adviser does not constitute an endorsement of the firm by the SEC nor does it indicate that the adviser has attained a particular level of skill or ability. Cahaba Wealth Management is not engaged in the practice of law or accounting. Always consult an attorney or tax professional regarding your specific legal or tax situation. Content should not be construed as personalized investment advice. The opinions in this materials are for general information, and not intended to provide specific investment advice or recommendations for an individual. Content should not be regarded as a complete analysis of the subjects discussed. To determine which investment(s) may be appropriate for you, consult your financial advisor.

The Case for International Stocks

By Don Keeney, CFA, CFP®

Many of us have heard statistics1 claiming:

  • Domestic stocks have outperformed international stocks eight out of the last ten years.
  • Domestic stocks have outperformed international stocks by a cumulative 20 percentage points over the last three years.
  • Domestic stocks have outperformed international stocks by a cumulative 50 percentage points over the last five years.

These truths make it seem as though investing in international stocks is a complete waste of time. To help explain why that’s not the case, let’s take a look at some additional data.

Figure 1

The above chart containing data from 1973 to 2022 outlines the following:

  • Over the last 50 years, domestic stocks have outperformed international stocks only 59% of those years.
  • International stocks have outperformed domestic stocks 100% of the time when domestic stocks had returns of less than 4% for the year.
  • International stocks have outperformed domestic stocks 96% of the time when domestic stocks had returns of less than 6% for the year.

Some of what we hear is rooted in Recency Bias. Recency bias is a behavioral pattern in which people incorrectly believe recent events will soon either occur again or persist indefinitely. This bias inhibits an individual’s ability to objectively gauge probabilities, which can lead to poor decisions. While domestic stocks have outperformed international stocks more recently, this has not consistently been the historical norm – nor can we say it will be the case in all future years. We have to separate recent market occurrences from future anticipated market movements.

There is solid evidence that shows the outperformance of one stock market over the other occurs in long cycles (see figure 2). The current cycle is now over 12 years long (including 2023 year-to-date). However, immediately before the current cycle started, international stocks outperformed domestic stocks for roughly eight consecutive years. While the below graphic consists of 5-year rolling returns and not stand-alone calendar years, the perspective remains meaningful. The current cycle is not going to last forever. Investors should acknowledge recency bias and expect the market to NOT stay that way.

Figure 2

When is the next cycle going to start? Who knows! Was international’s outperformance in 2022 the start of a new, long-term outperformance cycle? Who knows! Only one thing remains certain: at some point, the current performance cycle will flip, and international stocks will outperform domestic stocks (at least until the next cycle begins).

With this in mind, Cahaba Wealth Management appropriately constructs your investment portfolio to maximize the potential return for an appropriate amount of risk over the long term. The conversation above about which asset class is going to outperform another asset class actually misses the bigger, more important idea at play: diversification. Diversification is the process of spreading your investments around to multiple different asset classes so that your exposure to any one type is limited. As we tell our clients, diversification is the only “free lunch” in investing!

In other words, an investor can purchase two (or more) risky assets and simultaneously (1) improve the expected rate of return for the combined portfolio AND (2) reduce the portfolio’s overall expected risk. Diversification is a true “two-for-one special”! The only caveat is that the assets cannot act exactly like each other – meaning the assets should not have the same performance and volatility patterns. The more dissimilar the returns are, the larger the “free lunch”.

The takeaway is not to ask if international stocks will ever outperform domestic stocks again (or vice-versa); instead, it is to capitalize on the value of diversification and the resulting higher expected returns, with lower volatility, over your long term investing horizon. The inclusion of temporarily underperforming asset classes will always remain a positive contributor to your portfolio, given the power of diversification!

Don Keeney, CFA, CFP® is a financial advisor in the Nashville office of Cahaba Wealth Management, www.cahabawealth.com.

Cahaba Wealth Management is registered as an investment adviser with the SEC and only transacts business in states where it is properly registered, or is excluded or exempted from registration requirements. Registration as an investment adviser does not constitute an endorsement of the firm by the SEC nor does it indicate that the adviser has attained a particular level of skill or ability. Cahaba Wealth Management is not engaged in the practice of law or accounting. Always consult an attorney or tax professional regarding your specific legal or tax situation. Content should not be construed as personalized investment advice. The opinions in this materials are for general information, and not intended to provide specific investment advice or recommendations for an individual. Content should not be regarded as a complete analysis of the subjects discussed. To determine which investment(s) may be appropriate for you, consult your financial advisor.

1Source: ycharts.com